The Empty Promises of the Dashboard
Business Intelligence (BI) Dashboards are a term familiar for any business leader. It forms a collection of visual information displayed in a specific order used extensively in data analytics. Dashboards are used to convey related information in an easy-to-understand format. The history of a dashboard is a rather inconspicuous one where it is named after the dash used in horse-drawn carriages.
But it engages in a function of higher magnitude. Let us take a real-life example where dashboards are crucial. The cockpit of a fighter jet is filled with a lot of controls, but the dashboard plays the most important role. With real-time information ranging from altitude and fuel level to displaying any heat-seekers in the fighter’s tail, dashboards are lifesavers of the pilots, quite literally!
The same dashboard when translated into a board room helps leaders take decisions that have far-reaching consequences that can elevate or topple their business. In the wake of how important and powerful dashboards are for businesses, there is but one important question left.
Are modern BI dashboards delivering on their promise?
A question leaders must ask themselves. The dashboard has been touted as the one stop solution for metrics visualization and the great deliverer from the peril of data analytics. Still, they are plagued by many shortcomings. The great shortcomings of dashboards are highlighted below.
Less than a quarter (24%) of organizations are effective in using analyzed data – HBR
Information Overload
Nowadays, dashboards can be a real headache because they’re often filled with too much stuff that’s all jumbled up. This makes it tricky for folks in business to find the important things they need. It’s a bit like wandering around in a dense forest of data, and it’s tough to spot the things that actually matter.
Static Boards
One of the most significant shortcomings of business dashboards is their inability to provide real-time data. Many dashboards update periodically, meaning that users may be working with outdated information. In a rapidly changing business environment, this can be a critical drawback, as decisions made based on stale data may lead to missed opportunities or costly errors.
Inadequate Context
Dashboards typically focus on presenting data visually, which can sometimes result in a lack of context. Without a proper explanation or narrative, users may struggle to interpret the significance of the data points they see. This can lead to misinterpretation and misinformed decision-making.
Limited Interactivity
While modern dashboards have become more interactive, some still lack the ability to drill down into the underlying data or customize views according to specific needs. This limitation can frustrate users who require more detailed information or wish to explore data from different angles.
68% Of Data Available to Businesses Goes Unleveraged – Rethink Data, Seagate
Integration Challenges
Many businesses rely on multiple software tools and platforms to manage their operations. Integrating data from these disparate sources into a single dashboard can be a complex and time-consuming task. As a result, businesses may struggle to achieve a holistic view of their operations.
User Adoption Challenges
Not all users are proficient in interpreting data visualizations. Dashboards require users to have some level of data literacy, which may not be present throughout an organization. Training and support are often required to ensure that employees can effectively utilize dashboards.
External Dependency
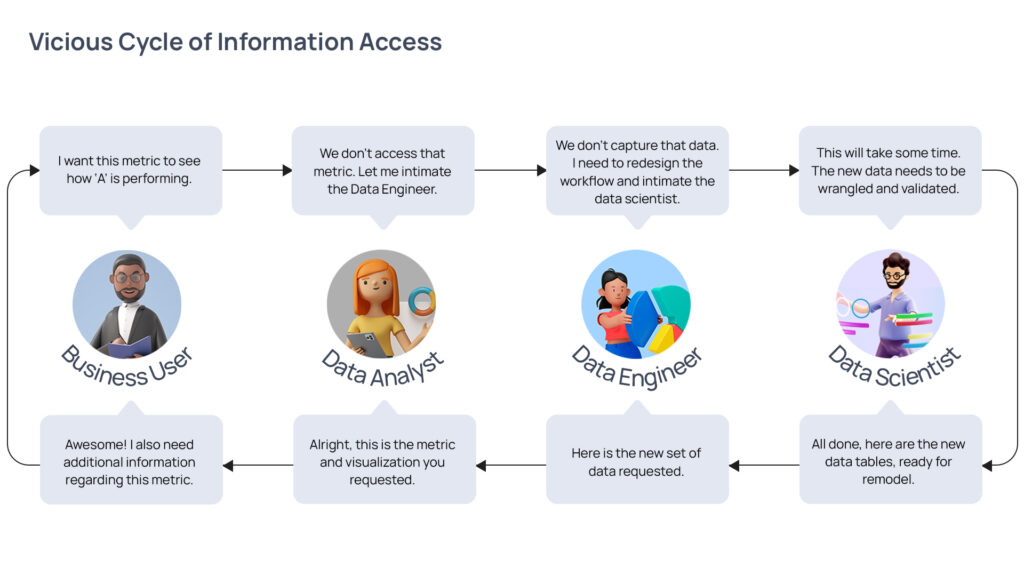
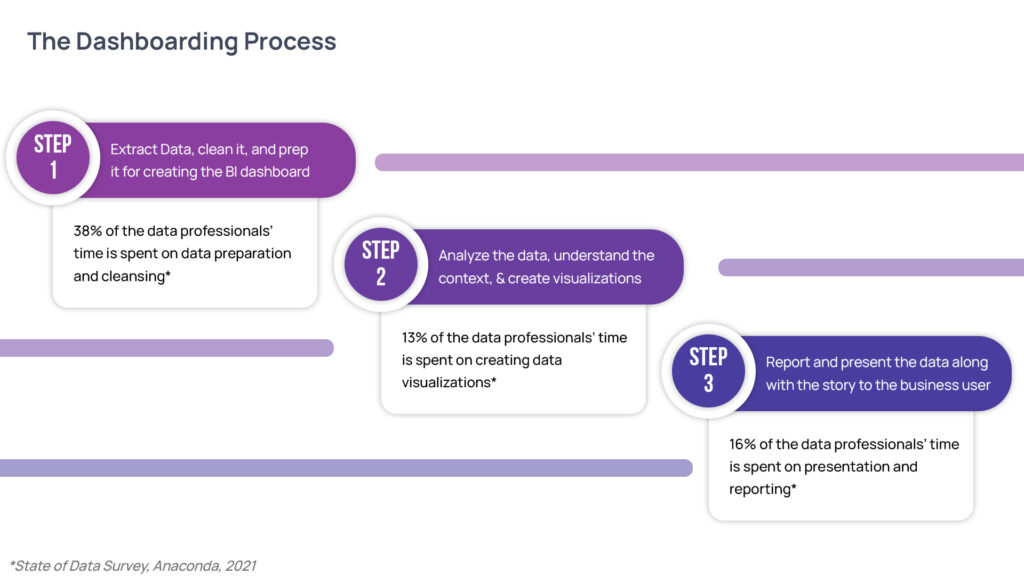
The process followed to create dashboards BI Dashboards require a team of expert data analysts, data engineers, and data scientists to prepare. The external dependency increases the turnaround time.
Lack of Personalization
Diverse set of users approach data analytics with different objectives. Insights must be personalized based on the context of the users. But today’s BI dashboards follow a one-size fits all policy with complex data access procedures.
Only 16% provide insights access to rank-and-file employees – HBR
Improving Insights through Trust, Governance, and Ease of Access
Like AI TRiSM, Data TRiSM is also gaining widespread attention. Data trust coupled with sound data governance policies play a central role in improving both the quality and usability of insights. This section delves into the crucial elements of trust, governance, and ease of access, highlighting their pivotal roles in enhancing and improving the quality of insights.
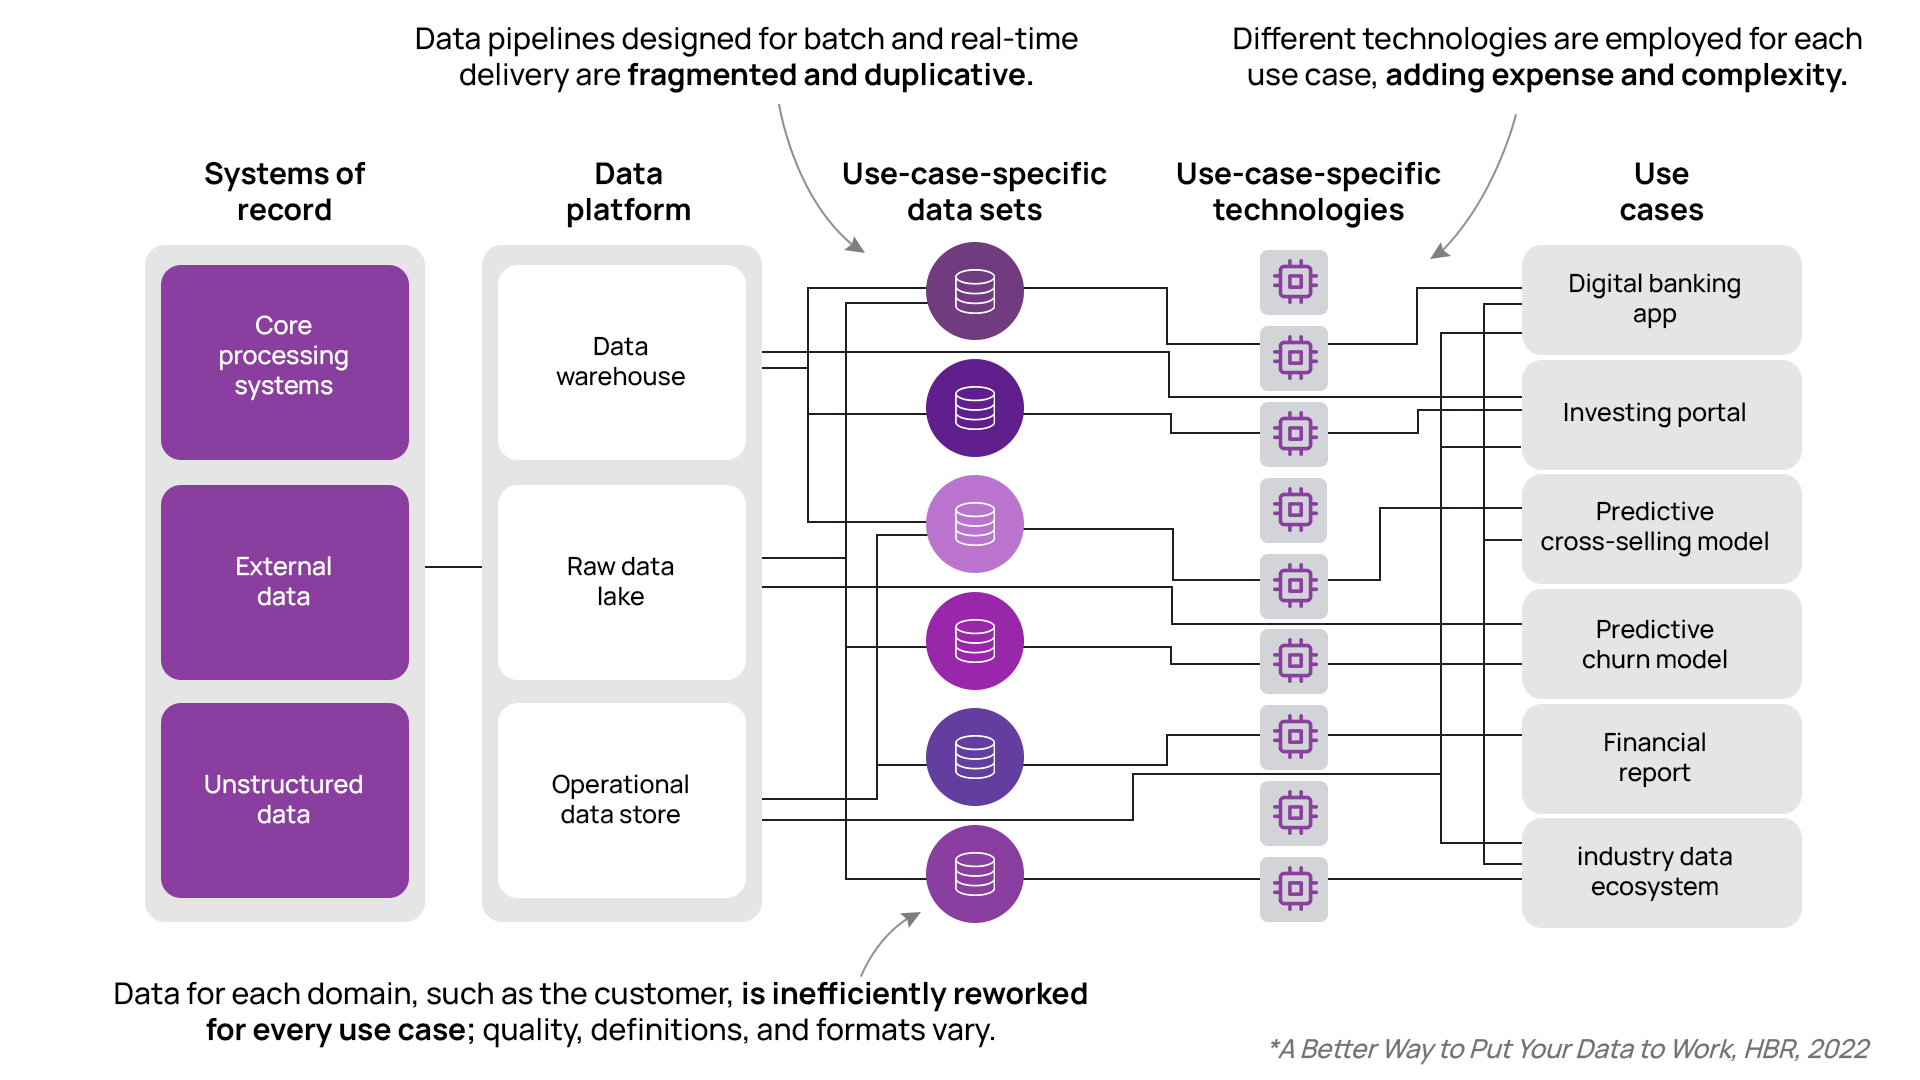
The current flow of data is through disparate systems and hence, business leaders question the integrity, context, and relevance of the insight.
Data Trust: The Bedrock of Insights
Data trust is the foundation upon which reliable insights are built. Establishing trust in data involves ensuring its accuracy, consistency, and integrity. Without a solid foundation of trustworthy data, any insights derived are bound to be shaky at best. Here’s how organizations can foster trust in their data.
- Data Quality Assurance: Rigorous data quality assurance processes are essential to validate and cleanse data. This involves identifying and rectifying inconsistencies, inaccuracies, and redundancies, ensuring that the data feeding into analytics processes is reliable and trustworthy.
- Data Privacy Measures: Trust also extends to the privacy of data. Robust data privacy measures such as obfuscating personally identifiable information are crucial for instilling confidence in stakeholders that their data is handled with the utmost care.
- Role-Based Access Controls: Implementing role-based access controls ensures that only authorized individuals have access to specific datasets. This not only safeguards sensitive information but also streamlines the analytics process by providing the right data to the right people.
Data Governance: Navigating the Data Landscape
Data governance provides the structure and rules that guide how data is managed and used within an organization. A well-established governance framework is essential for ensuring that data is not only trustworthy but also used responsibly.
- Data Governance Policies: Clearly defined data governance policies outline how data is collected, stored, processed, and shared. These policies set the guidelines for maintaining data quality, ensuring compliance, and mitigating risks associated with data usage.
- Regular Audits and Compliance Checks: Periodic audits and compliance checks help ensure that data practices align with regulatory requirements and internal policies. This ongoing oversight is essential for maintaining data quality and building confidence among stakeholders.
Ease of Access: Empowering Stakeholders
While trust and governance set the stage, providing easy access to insights is the spotlight that illuminates the power of data analytics. Improving accessibility involves making insights available to a diverse set of users in a format that is understandable and actionable.
- Self-Service Analytics: Empowering non-technical users with “true” self-service analytics tools allows them to explore and derive insights without relying on data experts. Ensuring the removal of technical barriers surrounding data access enhances agility and responsiveness within the organization fostering a data-first culture, especially amongst the rank-and-file employees.
- Omnichannel Accessibility: In an era of mobility and digital nativity, ensuring that insights are accessible on multiple devices provides flexibility to decision-makers. This accessibility enables timely decision-making, especially when stakeholders are on the move. It’s also equally important in demonstrating the capability to contextually present data across the devices. There must be continuity in accessing information and the data analytics tool must be device agnostic.
Data TRiSM is no easy task. To navigate through the uncertainties of the modern-day data practices with its voluminous data, ensuring Data TRiSM can be achieved through three importan actions.
- Cloud-First Approach: Implement a cloud-first data storage solution that acts as a single source of truth. Siloed data leads to fragmented insights and ultimately ineffective decisions. Changing the approach will motivate leaders to look at data as a product pumping in considerable gains to the organization.
- Data Center of Excellence: To implement strong Data Governance policies, a dedicated Data Center of Excellence (CoE) is a must. The CoE can periodically audit for compliance and take corrective actions if required.
- Intuitive Analytics Tool: A simple easy to access data analytics tool that improves insight access is a crucial step. It will encourage everyone to depend on data. To promote a data culture within the organization, organizations can look at data analytics tools that are conversational in nature, which uses language as an interface to derive actionable insights. Simply put, a tool that lets you Talk to Your Data™ in the language you speak.
Introducing the Analytics of the Future!
Say Hello to Kea – Our Smart Virtual Data Analyst
The first step is to understand that the biggest barrier to data-driven decision making is the complexity of data access. Modern dashboards are claustrophobic and are proving to be a bane rather than a boon in accessing insights. A primary reason for that is the business user who understands the context of data is not the one creating the dashboards.
The current data analytics or dashboarding tools are sophisticated and demand special training to even create the most basic of dashboards.
Overcoming this challenge is very simple. Let the business users access insights with the easiest and most intuitive interface – Language.
Kea is our flagship data analytics platform built with a conversational engine where you just need to Talk to your Data TM
Kea comes packed with a lot of features: –
- You can ask any question on your data, anytime, anywhere in simple English constructs
- You are not limited by a standard set of metrics in a dashboard
- Any new question or a metric is not a new project that costs time and money
- Engage in a conversation, build a data story, present it or share it
- All in one place, without the need for one app to do this and another to do that.