Introduction
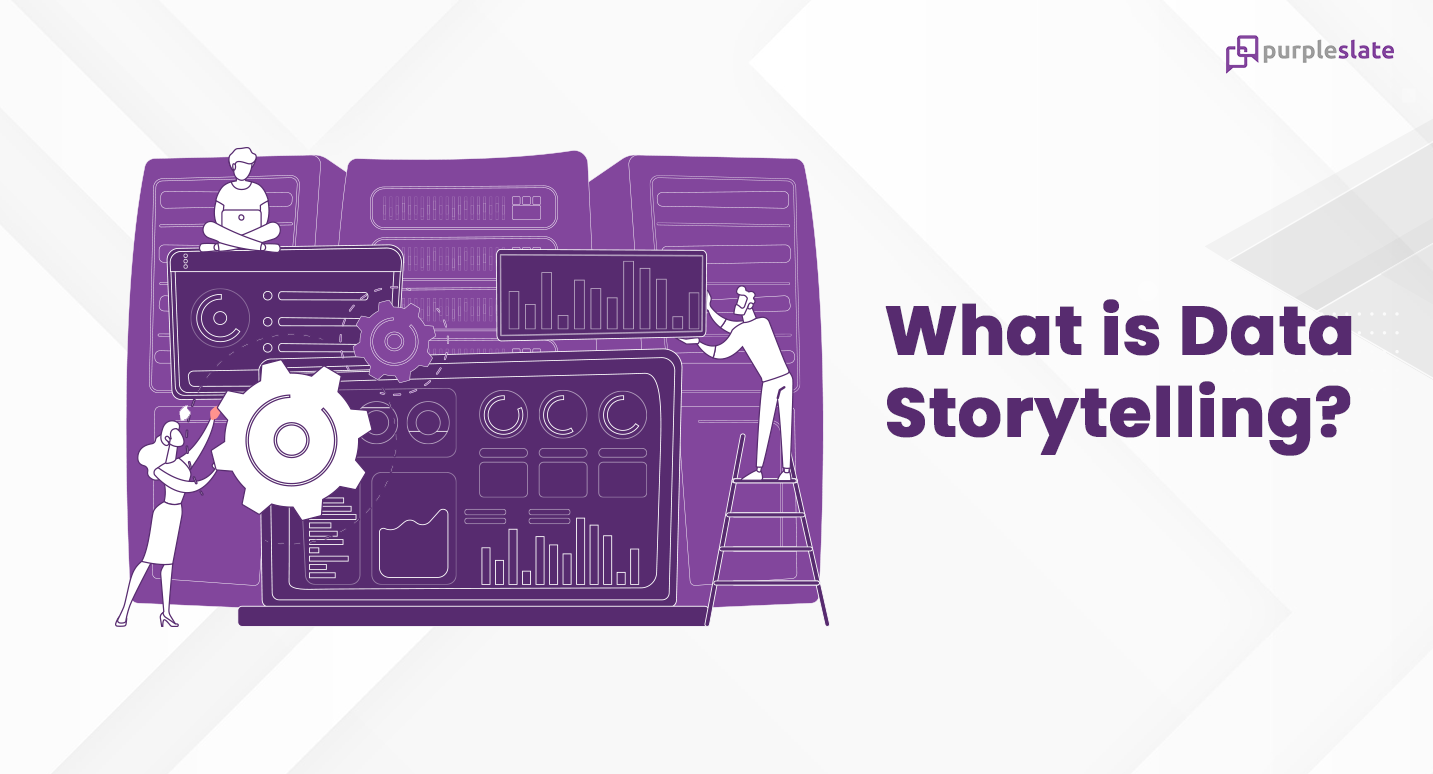
Data storytelling is a framework to communicate information in a way that is easy to understand. It can be used by many professionals, such as marketers and journalists. Still, it’s especially useful for data analysts because it helps them communicate their findings in a way that makes sense to experts and laypeople alike.
Take the Complexity Out of Data
Data storytelling is a framework to communicate information in a way that is easy to understand. It’s not the same as data visualization, nor is it the same as data science or analytics.
It can be used to tell any type of story, including but not limited to,
- A business case that demonstrates the value of your product or service
- An explanation of how you arrived at an answer
- A description of how customers use your products/services
Data storytelling refers to the process of using data and its visual representation in order to create stories. These narratives help readers understand how specific trends came about and how they’re evolving over time—they provide context for complex phenomena like crime rates across cities or population growth rates at different levels within countries’ borders—and make them more accessible by making them relatable rather than inaccessible abstractions such as numbers alone.
The Key Elements of a Data Story
There are three aspects that every data story must possess to make it relevant, engaging, and interesting.
- Data: When it comes to data-driven storytelling, it’s important to base your narrative on clean and accurate data. However, this can be difficult to achieve as data often exists across multiple countries, business units, and departments. With the advent of new data sources, such as IIoT, the volume of data is only increasing. For companies struggling to manage their data (which is most of them), data management solutions can help by collecting data from all sources and delivering trusted actionable insights. This is where we begin.
- Story: The chronological order that has been there for centuries for any story stays true for data storytelling also. There is an introduction, the context building, the middle, and invariably the conclusion built-in with the relevant takeaway. Data plays a supporting role in building credibility for the story points.
- Visual elements: A good visualization is like a map that shows you the relationships between data so that you can understand them easily and then use that information to think about what might happen next. Even though there are already programs that can make charts, graphs, and diagrams from spreadsheet data, it’s important to add written descriptions to those visuals so that readers will know what they mean and be able to see the context. A picture really is worth more than a thousand words: In this case, it might be worth looking at a visualization instead of reading through thousands of lines of data in a spreadsheet.
Data Storytelling – Understanding the Users & Need
Data storytelling can be used to communicate information about complex issues, help people understand data, and find patterns across large amounts of data.
Data storytelling can be used across all types of organizations, from government agencies to small businesses and even nonprofit organizations. The technique has been successfully applied to the fields of health care, education, consumer protection, and environmental policy—and there are applications for any field that requires understanding large amounts of information quickly so as to make decisions or take action on them immediately (such as natural disaster response).
Data storytelling can be a powerful tool for communicating data in a way that is easy to understand. It simplifies information and makes it more engaging by using visualizations, infographics, and other techniques that help you understand what the data means. It’s important to remember that data storytelling isn’t just about presenting numbers—it’s also about telling stories with them.
Conclusion – Stories with the Everchanging and Omnipresent Data
Data is everywhere and it is always changing. It’s the nature of data to be complex, difficult to understand, and important. Data storytelling helps you make sense of this complexity by putting together a story around your data in a way that makes it easy for people to understand what you’re seeing. Data storytelling doesn’t just mean telling stories about your numbers—it means telling stories with them! You can use charts or graphs as part of the narrative or even include text alongside them if you want more detail than just numbers alone can provide
It’s also important to keep in mind that not everyone will share your same vision when it comes time for the next phase of data storytelling. As such, it’s always good practice to take the time necessary to develop an idea before moving forward with it. Interested to learn more about data? Head over to our data glossary and deep dive into data engineering concepts.


