”We have all heard it said that one picture is worth thousands of words. Yet, if this statement is true, why does it have to be a saying? – Walter Ong, Orality and Literacy
Imagine you are staring at a dashboard like this. Like many of us who actively use data and insights for our operational decision making. While interpreting the different numbers and visuals in the dashboard, what you are internally trying to do is to get answers to questions you have in your mind at this point in time. Simply, Talk to your data™
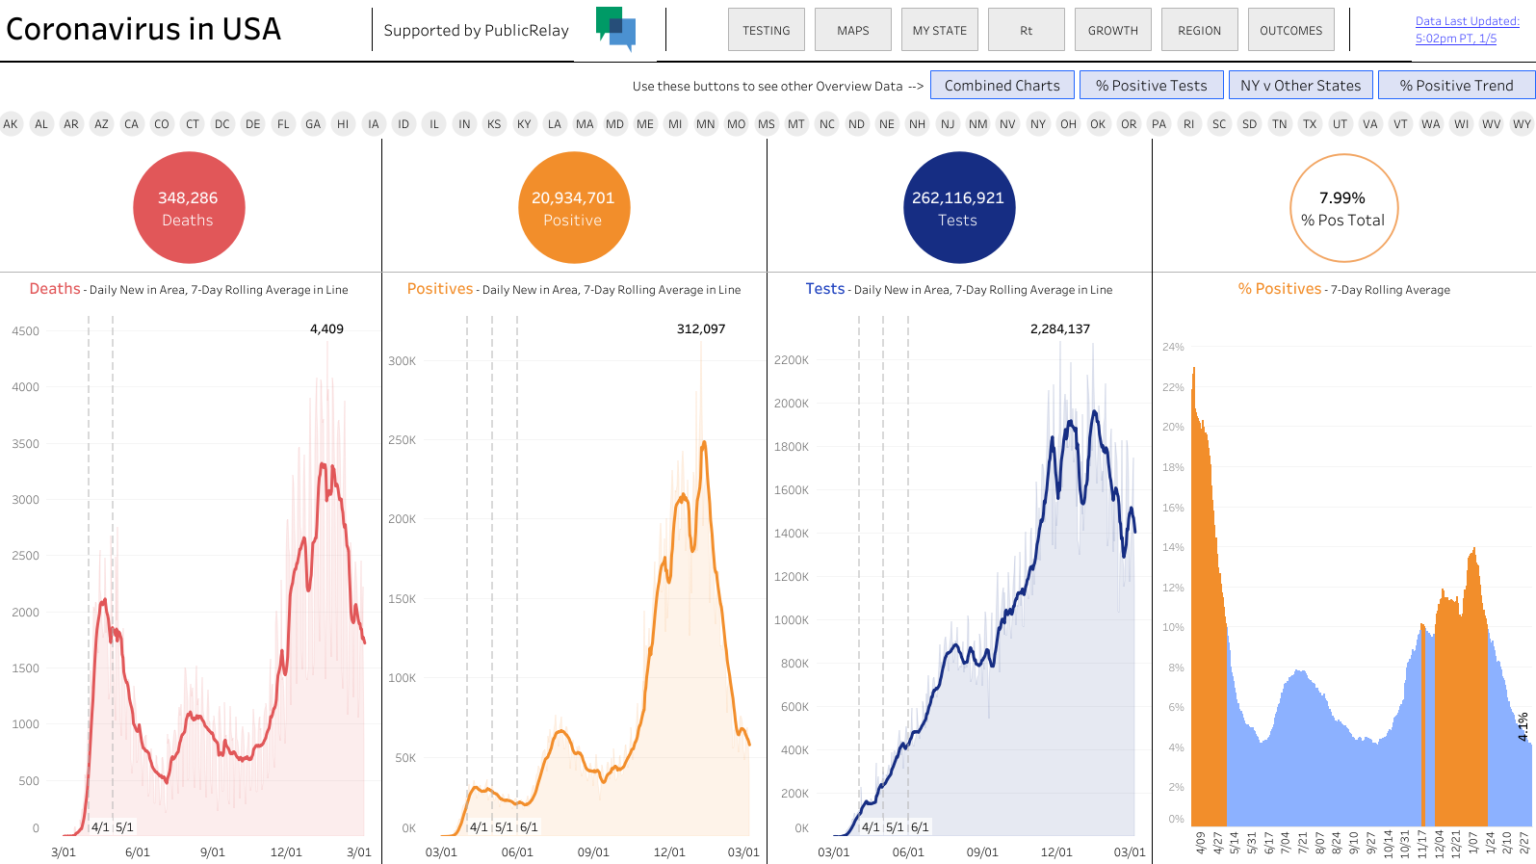
‘What is the positive cases count as of today?’
‘How has it been trending this year?’
‘Why is it spiking again this month?’
‘How much is it in my state?’
‘How about my city?’
‘How is my city compared to the others?’
‘Which state is worst affected?’
‘Which state is the least affected?’
Essentially, consuming data insights, or in general becoming knowledgable, consists of two high level parts. The Questions and the Answers.
Questions
In the above example, if these are the standard set of questions that you would consistently be asking every time, then a dashboard like that ideally serves the purpose.
The challenge is that, more often than not, we run into these challenges with any data analytics output.
- Our questions are not finite, especially if you are a seeker
- The questions varies based on who is asking the question and their knowledge levels
- And, most importantly, the answer always leads to more questions
Answers
Some of the answers are direct facts, where you clearly knew what to ask, while some of the answers are revelations, where you did not have the question on your mind, but you were intrigued by the fact. ‘Hmm. I din’t know that’.
Any BI or Data Analytics application should help the users in two primary outcome.
- Get objective answers to the straight questions you have in your mind that can be used for decision making or to take actions or simply called as Needs
- An equally effective outcome is when it helps unravel answers that you dint’ even know existed. What we call as the wow moments or the ‘Hmm. That’s interesting moments.’
The Conversational approach
Imagine, in the absence of this dashboard, you are talking to someone knowledgable on this topic. A teacher or an expert or a data analyst. How would that interaction be, especially if this topic is closer to your heart and you are in dire need of this information.
Nothing but a series of questions, answers, discussions.
‘What bad is Covid as of today?’
‘How is it trending so far this year?’
‘I see a spike last month. Can you zoom in on that?’
‘How much is it in my state?’
‘How about my city?’
‘How is my city compared to the others?’
‘Which state is worst affected?’
‘How is the vaccination rate in that state?’
‘How is the trend in the states with high vaccination rates?’
All kinds of questions on the topic – one leading to the other, especially triggered by the answer you got in your previous question. In the end, you find that conversation to be quite fulfilling, enriching and most importantly enlightening. That’s the true power and out come of Data and Information.
So, what’s the difference?
- You are not constrained by what’s available in the dashboard and
- The questions are more aligned to your knowledge level and your sequence of thought, unraveling one answer after the other, eventually leading you to the end goal of being well-informed.
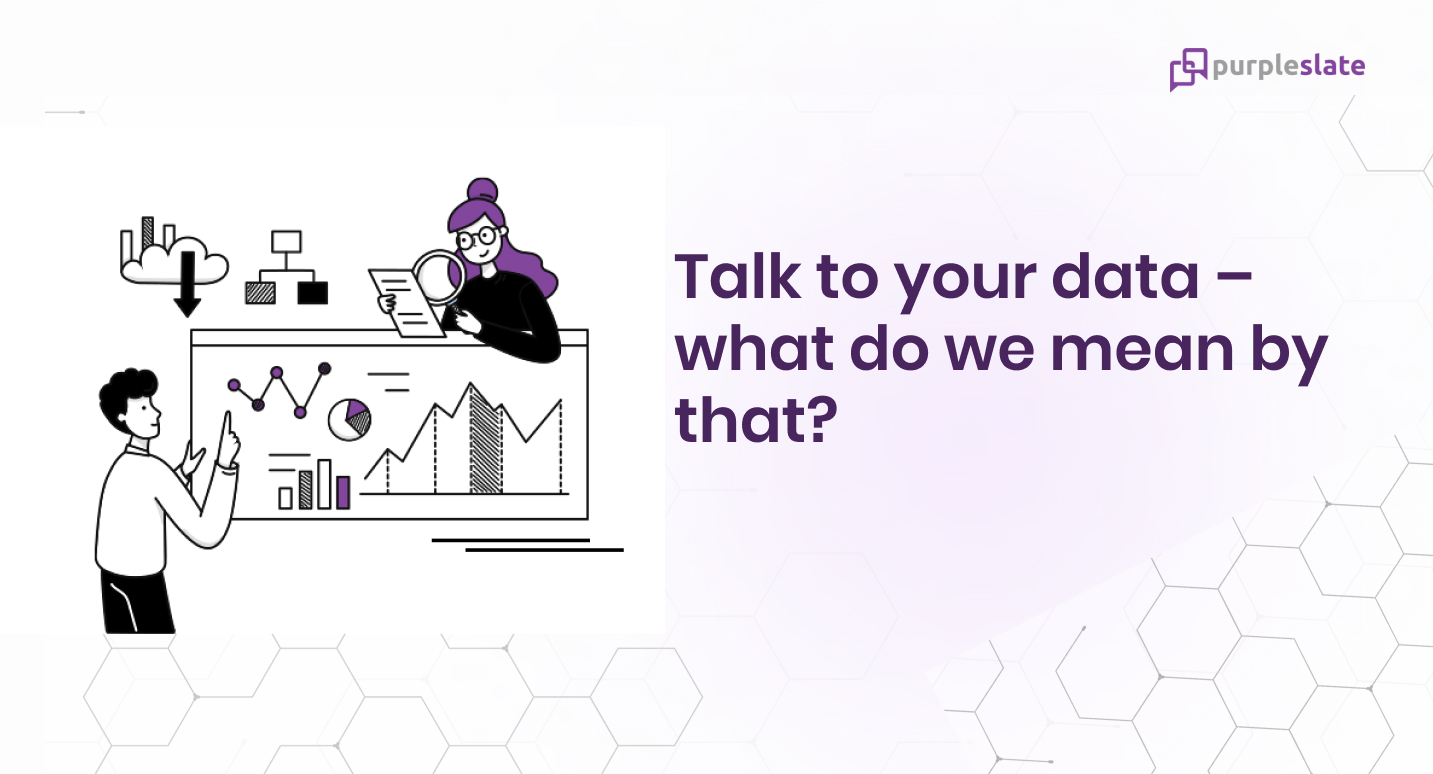
That’s what we mean by ‘Talk to your Data’.