Shortcomings Of Self Serve Analytics
The 4 Great Shortcomings of Modern Self-Serve Analytics

In today’s data-driven world, organizations have access to vast amounts of data. This data can be used to gain valuable insights into business operations, customer behavior, and industry trends. However, not all business users have the technical expertise to work with data or create meaningful visualizations. This is where self-serve analytics tools come into play....

Common Data Visualization Methods and Where to Use Them

Preface Data visualization is an essential skill for any data scientist. Data visualization is an interdisciplinary science dealing with the graphical representation of data and information using various formats like charts, graphs, and maps. Data visualization forms the core of data storytelling, where data is presented in a framework that simplifies the communication of information....

Data Storytelling
What is Data Storytelling?

Introduction Data storytelling is a framework to communicate information in a way that is easy to understand. It can be used by many professionals, such as marketers and journalists. Still, it’s especially useful for data analysts because it helps them communicate their findings in a way that makes sense to experts and laypeople alike. Take...

Self-Service Analytics
What is Self-service Analytics and how does it work?

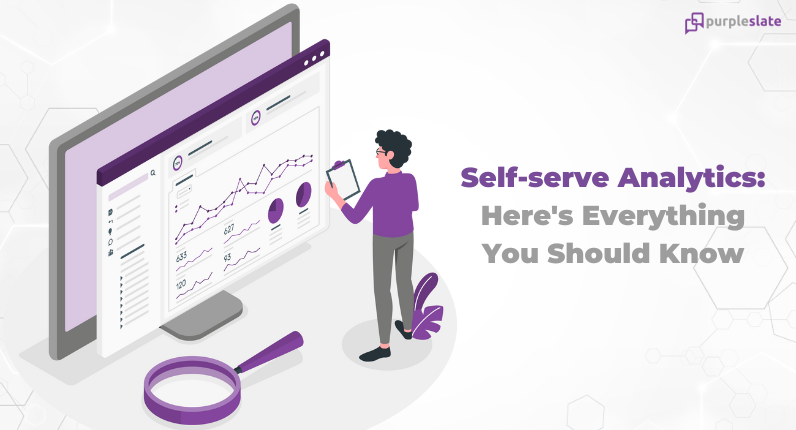
Self-service analytics is an analytical user interface that allows customers or businesses to analyze data without requiring assistance from a data analyst or other IT staff. It provides users with the ability to derive insights using intuitive visualization tools and natural language querying. Users can find answers to their questions, take action on the results,...

Bi Tool Features
10 Key Features that Make a Business Intelligence Tool Work for You

A BI tool will radically improve your business operations, but only if it’s the right tool for your organization. Choosing a BI tool can be a lengthy process since the BI tools market has become more fragmented and complex, making it difficult for businesses to make the right choice. There are hundreds of BI tools...

Data Rich Information Poor
Data Rich, Information Poor

Do you know how much is a Zeta byte? I was quite intrigued by this graph from Statista. It talks about the amount of data that is created, consumed and stored with some projections till the year 2025, with up to 181 Zeta bytes of data. While much of this data could be transient, as...

© 2022 Purpleslate Private Limited | Made with 🤍 at Chennai, India