There has been an increasing chatter around this topic whether Dashboards are dead. Just google it around and you will find so many diverse perspectives on this topic, both for and a bunch of nay sayers as well.
Are they really?
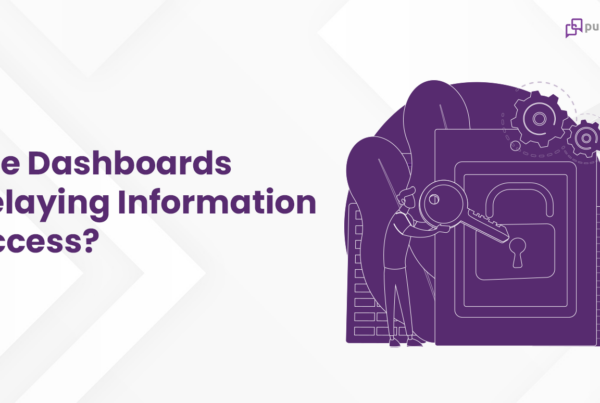
What are Dashboards?
If you have worked in the area of Data and Analytics, you would very much have been part of the evolution of the information systems – from reports to charts to eventually the dashboards. Dashboards which happen to be, in simple terms, a collection of interesting numbers and visuals that are worth capturing, monitoring and sharing with others for continued use, have been in existence and usage for quite a few years now.
The basic premise has been that these numbers and visuals, called as Key Performance Indicators or KPIs, are a group of information relevant to a specific objective or a business process, that provides a *big picture* and that is worth paying attention to. In short, dashboards served the information needs of a diverse set of users within an enterprise, towards improving the transparency across the organization and in managing the overall operations in an objective manner. And, again based on who created these dashboards from a technology perspective, they fell anywhere in the landscape between the Technology to the Business teams.
Why dashboards are dead?
Now, using the above simple definition of dashboards, let’s look at some of the key challenges that’ve been plaguing the way information has been consumed via dashboards.
- ‘It is not useful to me. I don’t have what I need.’ Diversity of Information needs. The very definition of Key Performance Indicators (KPIs) or in simple terms, the numbers worth tracking keep changing based on who the user is. The data needs of diverse set of users are …, yes, diverse. It is extremely challenging to box the information needs of everyone into a finite, yet limited set of metrics. It won’t be a common crib in many organizations about the lack of usage and adoption of many of these dashboards.
- ‘I just can’t figure this out.’ Complexity and hence lack of Clarity. How do you solve the above issue? Simple. Either you create more dashboards to cater to more users, which leads to dashboard proliferation or you make the existing dashboards complex, by adding more metrics, complex visuals and filters. This had a direct impact on the very purpose of dashboards, directly impacting clarity.
- ‘It takes forever to get what I want’. Everything is a project. This is the classic IT vs Business tug of war. Any changes to the application dashboard, involved technical work, took time and effort and this had a direct impact on the availability of information and hence the hidden costs of decision making. This also led to the evolution of self-service BI – a no-code software application that lets business users to create their own metrics and dashboards, without writing any code. What a liberation, you would think. Very soon the liberation became a pipe dream in that the no-code platforms really became bloated with features that you needed an engineer to figure them out. Back to the waiting line of the IT team.
In addition, the information needs of any modern digital worker have evolved along with the amount of data that is being captured. It is no longer limited to a set of standard KPIs that are made available in a dashboard. The dataset has grown in volume, the information needs have become momentary and highly contextual. The analytics toolset just needs to evolve to meet the changing needs.
A Conversational Approach to data insights.
Think about it.
An ecosystem with a strong data driven culture is one where the decisions are more objective, backed by data and information, than gut feel or even worse shooting in the dark. And the users just have questions on data and they need answers – not a dashboard. And, the questions can be as diverse as the set of users interacting with the dataset.
Which region had the least sales on Products in The last quarter?
How is the adoption trending on the new mobile app feature that was launched last month?
What is the average pre-open orders count in the last 24 months?
The true efficacy of data is not just in ability to deliver the answer for decision making, but often in its ability to trigger a range of follow-up questions around the periphery of the answer that was provided. That is the true power of knowledge – our ability to ask more meaningful questions and get clarity. As Socrates said, Questions are more important than Answers.
Any modern day analytics solution should equip the users with this capability. Add to that the ability to ask questions in simple English constructs.
Let your users switch from pre-fabricated dashboards and create their own story board, bottom-up, one answer at a time. Ask a question, you like the answer, add it to a storyboard. Craft a personalized storyline that helps you narrate a story, derive a conclusion, take a meaningful action, share it with someone and have a conversation.
Eliminate the project backlog – getting a new insight or a metric should no longer be a project requirement. A new insight is just another question which the analytics application is able to answer, without your IT team or writing any new code.
In summary, the future of analytics is all about the convergence of
- Getting answers to questions on data
- In a simple language interface
- Have a conversation on your data
Kea just makes that possible.
So to answer the initial question, are dashboards dead? No, Dashboards are not dead, just that they might have lost their utility value.