Besides all the technologies and tools, what makes a good data analyst and what makes some organisations be so good with their data efforts? This is where we have to understand that data intelligence cannot be equated to just the tools and techniques used.
If there is anything holding you back in your data science success, you would be surprised to know that technology is not one of them. For enterprises, spending millions on the technology platform or getting the smartest quant specialists is not going to guarantee them the competitive advantage. There is enough evidence that most of them continue to struggle in their data efforts.
Similar argument applies for the aspiring learners in this field. Despite the internet rife with so much of free knowledge and wisdom from experts across the globe, why are we still struggling to get to terms with building meaningful data intelligence skills?
Here is my take on what it takes to be a good and meaningful data analyst, which I dread to call as ‘principles’ or ‘cookbook’, for there are so many such recipes available off the shelf.
Rather, I would call these as my own practices that I learnt the hard way and that resulted in reasonable success in my data work and in making a case for it.
End of day, all of these might sound too elementary like ‘brush your teeth twice a day’ or ‘eat your veggies’. Again, sticking to basics are the toughest and that we easily forgo.
Everyone (including me) tries to teach everything that they feel is important for them and unfortunately the Basics is not one among them.
So, here they go.
Know the Why.
Know the Why of your Data Science experiment. Borrowing Simon Sinek’s famous aphorism, always start with the Why on your data assignment. Why are you even doing this? What are the questions you want to answer with data? How is this going to open up new avenues to aid decision making? Why does someone need this analysis? How would they use it? Do you have all the required data?
These are some essential Whys that you need to think about, before you even start playing around with your data.
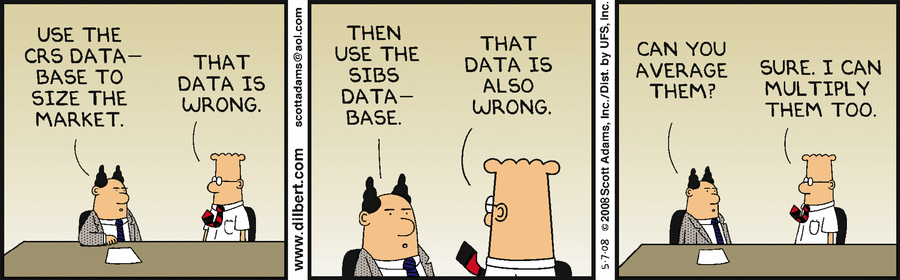
Data is messy.

Metaphors cannot be of convenience and fancy value alone.
If Data is the new oil, data extraction is a messy and difficult job as well. It is a painful task to source, extract and curate the data before someone gets to do the less messier tasks to refine, package and ship it. Despite all the advanced technology available, bringing the black gold out of the deep wells into the surface takes painful effort and is not easy. If you want to be a successful data scientist, be ready to get your hands and perhaps your full body dirty.
Many of my students give me a puzzled stare when I tell them nearly 70% of your Data Science work is with the Data, that includes sourcing, cleansing, munging, wrangling or whatever you want to call the dirty work. So, be prepared for the tough grind.
Provenance.
Know your data source. Though, this could very well be part of the previous step, I want to highlight this separately, primarily for the reason that ‘as you sow, so you reap’ and it is extremely important to have a clear understanding of the provenance of the data you are analysing.
This is one of the common mistake I have seen at work places. ‘I don’t know much about this data and I am just doing a Chi square distribution.’
What?
Exactly! Don’t become a jargon or tool junkie without understanding what the data really means.
The single biggest mistake you can make on any data intelligence exercise is compromising on the Data Provenance. You should be able to clearly answer questions like:
- How was this data collected?
- Is it a sample or the complete population?
- Has it gone through any transformation and what are those?
Your statistical models or any jazzy charts you may produce are only as good and reliable as the underlying data.
Pay attention to the timeliness of the data, reliability, correctness, understanding of the data dictionary and every other data element.
Say you are working on a click thru analysis of an eCommerce website and let’s assume there is a table somewhere that is called “Portal Usage Data”. Ask some basic questions.
- Does this table include all the usage?
- Does it cover all the channels – web, mobile and any other means? Is it real-time info or time based?
- Is it the master information or a replica of some other source? How authentic is the source?
You really need to pay attention to this much detail if you want your users to rely heavily on your analytics. Clarify your assumptions and know your domain vey well or talk to someone who knows the domain well.
Profile your Data.
I call it the warmups. No professional athlete would start a game without a decent warmup and no data analyst should start a data experiment without a simple Exploratory Data Analysis or EDA.
Slice and Dice it to the best you can. Start with the simple measures of central tendency, frequency distribution and missing values. Look at it from multiple perspectives, and look for surprises early in the data science experiment before you dig deeper.
- Does it even make sense? Don’t start the work because someone asked you to produce some charts.
- As much as Data is about making things objective, I rely heavily on my hindsight and I believe a good data scientist develops a data hindsight over his career that leads to moments like – ‘Hmmm. This doesn’t add up.’
- These are the moments that really differentiate a seasoned data veteran to an amateur data scientist who rakes up metrics for the sake of it.
- Pay attention to fallacies like Simpson’s paradox – aggregates can be totally misleading, though they are done deliberately at times.
Check, check and check.
It just puzzles me when someone talks at length in a meeting with a bunch of charts with some very obvious flaws. What gives them that confidence?
Confirmation Bias has a serious impact on your analysis and so does tight deadlines and work pressure. But, the last thing you want to do, is to look like an idiot in front of your audience, especially when you are presenting the findings yourself. One fundamental flaw – and there goes your credibility flying out of the window. Rest of the meeting is just another namesake.
One common method I always follow is to deconstruct the metrics with a trail of breadcrumbs of simple arithmetic.
The other one would be to review it with a subject matter expert who knows the domain and the data and asking them the simple question – ‘Does this even make sense?’
Derive the confidence on your work based on the ground work you have done, not on the tools and techniques you had used.
Never underestimate your Users.
I saved the most important for the last.
Extremely important for every data analyst to know. Never take them for granted and do so at your own peril.
- Who is your user?
- How would they use this metric?
- What decisions would they make?
Sin No. 1
One important corollary of this knowledge of your users is the way you communicate your data story. Know their information need – do they care about decimal point precision or directional movement?
Don’t build a jazzy iPad app for someone whose daily job is in front of a command line interface.
Agreed, technology is changing and you stay current. Unfortunately if it is someone’s daily job to stare at a cockpit of displays and your job is to make it available in the medium they care about.
Sin No. 2
Never underestimate their knowledge of the data when you present to them. You could be armed with the latest trends and a collection of new toys and techniques, but they know their Data.
I have been in meetings where someone presents some fancy charts to a business stakeholder to their utter dismay of ‘what the hell is he talking about?’.
The most common politically correct feedback of ‘Interesting!’ could very well mean ‘Do you even know what you are talking about?’
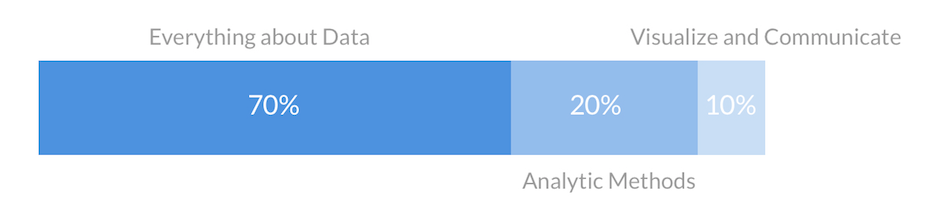
In summary, if I have to take a quantify the steps in effective data analysis, it would look something like this.
Always remember, there is no miracle with the tools and they are no good in producing magic out of foundational flaws. Pay attention to what goes in and how it is processed to produce gold (the data version of it).
There is no other way.